
Has listening to the news left you feeling like there's no hope for Charlotte's real estate market? Well rest assured that every cloud has a silver lining and if you're living in Charlotte's Dilworth neighborhood your silver lining keeps getting brighter. Real estate trends and fluctuations in the housing market can't always be applied to all areas of the country. Some states have seen gains in home values, some have seen declines in home values, some states have seen increases in population, some have seen decreases in population. The point is there is no calculable method that can be applied to all real estate markets. Every state, every city, every neighborhood, every house will be effected in a different way by real estate market trends.

North Carolina has continued to grow in the downturn and is forcasted to be one of the fastest-growing states in the country; that means more people needing homes in Charlotte which translates to your home being worth more. It's a simple case of supply and demand.
Now let's narrow the area down even further: Dilworth is one of Charlotte's most sought-after neighborhoods and its small size means there is limited supply available to a growing number of potential buyers. If you have a home in Dilworth rest assured that the sky is not falling and you are in one of a few neighborhoods that are seeing increases in real estate values. The most recent Neighborhood report for Dilworth shows these stats:
Homes in Dilworth currently for sale: 41
Average list price: $592,365 ($234.13/sqft)

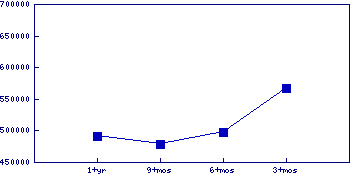
Average price of homes sold
Past 1 yr = $491,547
Past 9 mos = $478,999
Past 6 mos = $497,671
Past 3 mos = $566,400
- This graph clearly shows the value of Dilworth homes showing a continuous growth pattern.
 Average price/sqft of homes sold
Past 1 yr = $196.26
Past 9 mos = $190.90
Past 6 mos = $191.61
Past 3 mos = $201.17
- These figures show that, on average, homes in Dilworth are experiencing continuous increases in value over the last 9 months and can provide a rough idea of what a buyer might be willing to pay for your home.
Average "discount" off list price given by sellers
 Past 1 yr = 5.04%
Past 9 mos = 4.4%
Past 6 mos = 6.22%
Past 3 mos = 9.22%
- These figures show that sellers are becoming much more flexible and willing to negotiate on the price of their house.
The graphs provided show what appears to be a market bottom for the Dilworth neighborhood nine months ago, and continued growth in real estate values since. If you're looking to sell your house, I hope these figures help you sleep better at night. If you're a potential buyer looking to move to Dilworth, I hope these figures show you that moving to Dilworth is an investment in your future.
If you'd like to receive these Dilworth market updates monthly, email me (DilworthCharlotte@gmail.com) and I'll sign you up. You'll simply receive the charts and data. Nothing more, nothing less.
Have a great weekend!
If you'd like to receive these Dilworth market updates monthly, email me (DilworthCharlotte@gmail.com) and I'll sign you up. You'll simply receive the charts and data. Nothing more, nothing less.
Have a great weekend!
 Labels:
Charlotte,
Charlotte home values,
charlotte real estate,
Dilworth,
dilworth real estate,
Selling
Labels:
Charlotte,
Charlotte home values,
charlotte real estate,
Dilworth,
dilworth real estate,
Selling
 Previous Article


Responses
0 Respones to "Current Dilworth Home Values"
Post a Comment